The National Venture Capital Association recently released their latest venture investment numbers for the US. On their web site, they use the annoying iChart gadget. Annoying because as you scroll backwards and forwards in time, it adjusts the x axis, so I can't really compare amounts across time. Why would they do that? Are they mad? I'm going to send Edward Tufte to beat them over the head with Javanese railroad timetables.
Anyhoo, so I took their US regional data and charted it more congenially (click on the charts for larger versions. I graphed the three largest regions, Silicon Valley, New England and NY Metro. Here is total investment:
 I've heard a lot of talk recently about New York having a startup renaissance. My Boston VC friends have meanwhile been bemoaning how quiet Boston is, and living on the Acela to NYC. The data does not support this. New England may be a bit ghost-towny, but NY isn't taking off.
Let's look at number of deals:

Same. I mean, I don't have access to the NVCA database, just their publicly released data. If I did have access, I would do this analysis with early-stage internet companies; that may show a different story.
Average deal size:
 This is interesting mainly because it shows average investment size to be about the same from region to region (although NY is noticeably more volatile, while Silicon Valley less so--probably because there are more deals.) I find this surprising, given the different character of industry in the three areas. I wonder if this is a product of the VC model, as opposed to actual business capital needs: the tail wagging the dog. This is anecdotally so, and certainly not a good or efficient thing if true.
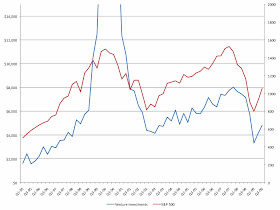
The other interesting thought that came up was the big drop in investment Q1 and Q2 of this year and the slight pick-up in Q3. I thought this was happening, as I noted in Is the Time for Angels Passed? Here's the proof. There are many potential reasons for this, but the most obvious is that VCs invest when they see the economy getting better. Here's a graph of Total US VC Investment (left scale) and the S&P 500 (right scale):
 Well, now. Aside from a bit of the euphoria in 2000, VC investment tracks pretty well. In fact, it looks like it may lag a quarter or two. Why is this? Leaving aside the canard that venture is uncorrelated, venture investment lifecycles are not the same as public company lifecycles. You might invest in IBM this year, expecting them to raise their dividend next year because of the improved economy. But you shouldn't invest in non-public companies that way. You should expect your venture investments to mature in three to five years (depending on the stage at which you invest.) Unless you really don't believe in the business cycle, the best time to invest is when the stock market is low. Venture investment should be counter-cyclical. Is this a case of a buy high, sell low mentality, or another structural failing of the VC model?
I can see the Empire State Building out my window. When they turn the lights out at 2am I know I'm going to be tired tomorrow.
This comment has been removed by a blog administrator.
ReplyDeleteThe exact answer
ReplyDeleteGood brief and this post helped me alot in my college assignement. Say thank you you as your information.
ReplyDeleteEasily I acquiesce in but I think the collection should prepare more info then it has.
ReplyDeletenice post. thanks.
ReplyDelete